
FineTest
SKU:EH0881
Human TAC1(Protachykinin-1) ELISA Kit
Human TAC1(Protachykinin-1) ELISA Kit
Couldn't load pickup availability
TAC1|Protachykinin-1|Tac1|Neurokinin-1|neurokinin 1|neurokinin 2|neurokinin A|neuromedin L|neurokinin alpha|neuropeptide K|neuropeptide gamma|neuropeptide gamma|neuropeptide K|NK2|NKA|NKNAneurokinin alpha|NPK|PPT|protachykinin-1|substance K|substance P|TAC2neuromedin L|tachykinin 2|tachykinin|precursor 1|tachykinin|precursor 1|substance K|substance P|neurokinin 1|neurokinin 2
Product Name
Human TAC1(Protachykinin-1) ELISA Kit
Alias
TAC1 ELISA Kit, Protachykinin-1 ELISA Kit, Tac1 ELISA Kit, Neurokinin-1 ELISA Kit, neurokinin 1 ELISA Kit, neurokinin 2 ELISA Kit, neurokinin A ELISA Kit, neuromedin L ELISA Kit, neurokinin alpha ELISA Kit, neuropeptide K ELISA Kit, neuropeptide gamma ELISA Kit, neuropeptide gamma ELISA Kit, neuropeptide K ELISA Kit, NK2 ELISA Kit, NKA ELISA Kit, NKNAneurokinin alpha ELISA Kit, NPK ELISA Kit, PPT ELISA Kit, protachykinin-1 ELISA Kit, substance K ELISA Kit, substance P ELISA Kit, TAC2neuromedin L ELISA Kit, tachykinin 2 ELISA Kit, tachykinin ELISA Kit, precursor 1 ELISA Kit, tachykinin ELISA Kit, precursor 1 ELISA Kit, substance K ELISA Kit, substance P ELISA Kit, neurokinin 1 ELISA Kit, neurokinin 2 ELISA Kit
Detection Method
Sandwich ELISA, Double Antibody
Application
TAC1 ELISA Kit allows for the in vitro quantitative determination of TAC1 concentrations in serum, plasma, tissue homogenates and other biological fluids.
Size
96T
Range
4.688-300pg/ml
Sensitivity
< 2.813pg/ml
Species
Human
UniProt ID
Standard Curve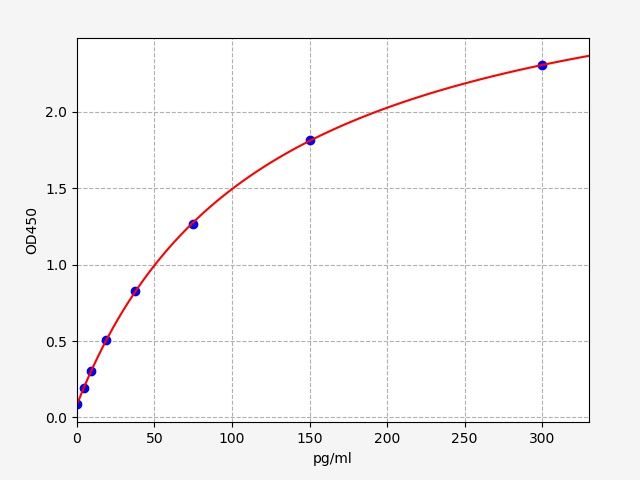
Storage
2-8 ℃ for 6 months
Recovery
Matrices listed below were spiked with certain level of TAC1 and the recovery rates were calculated by comparing the measured value to the expected amount of TAC1 in samples.
|
Matrix |
Recovery range(%) |
Average(%) |
|
serum(n=5) |
90-103 |
96 |
|
EDTA plasma(n=5) |
87-93 |
91 |
|
heparin plasma(n=5) |
95-102 |
99 |
Linearity
The linearity of the kit was assayed by testing samples spiked with appropriate concentration of TAC1 and their serial dilutions. The results were demonstrated by the percentage of calculated concentration to the expected.
|
Sample |
1:2 |
1:4 |
1:8 |
|
serum(n=5) |
86-95% |
90-102% |
91-104% |
|
EDTA plasma(n=5) |
83-98% |
83-98% |
85-101% |
|
heparin plasma(n=5) |
83-96% |
80-100% |
80-96% |
CV(%)
Intra-Assay: CV<8%
Inter-Assay: CV<10%
Note
For Research Use Only
