
ELK Biotechnology
SKU:ELK7451
Goat EDN1(Endothelin 1) ELISA Kit
Goat EDN1(Endothelin 1) ELISA Kit
Regular price
$588.00 USD
Regular price
Sale price
$588.00 USD
Unit price
per
Shipping calculated at checkout.
Couldn't load pickup availability
Goat EDN1(Endothelin 1) ELISA Kit
Overview
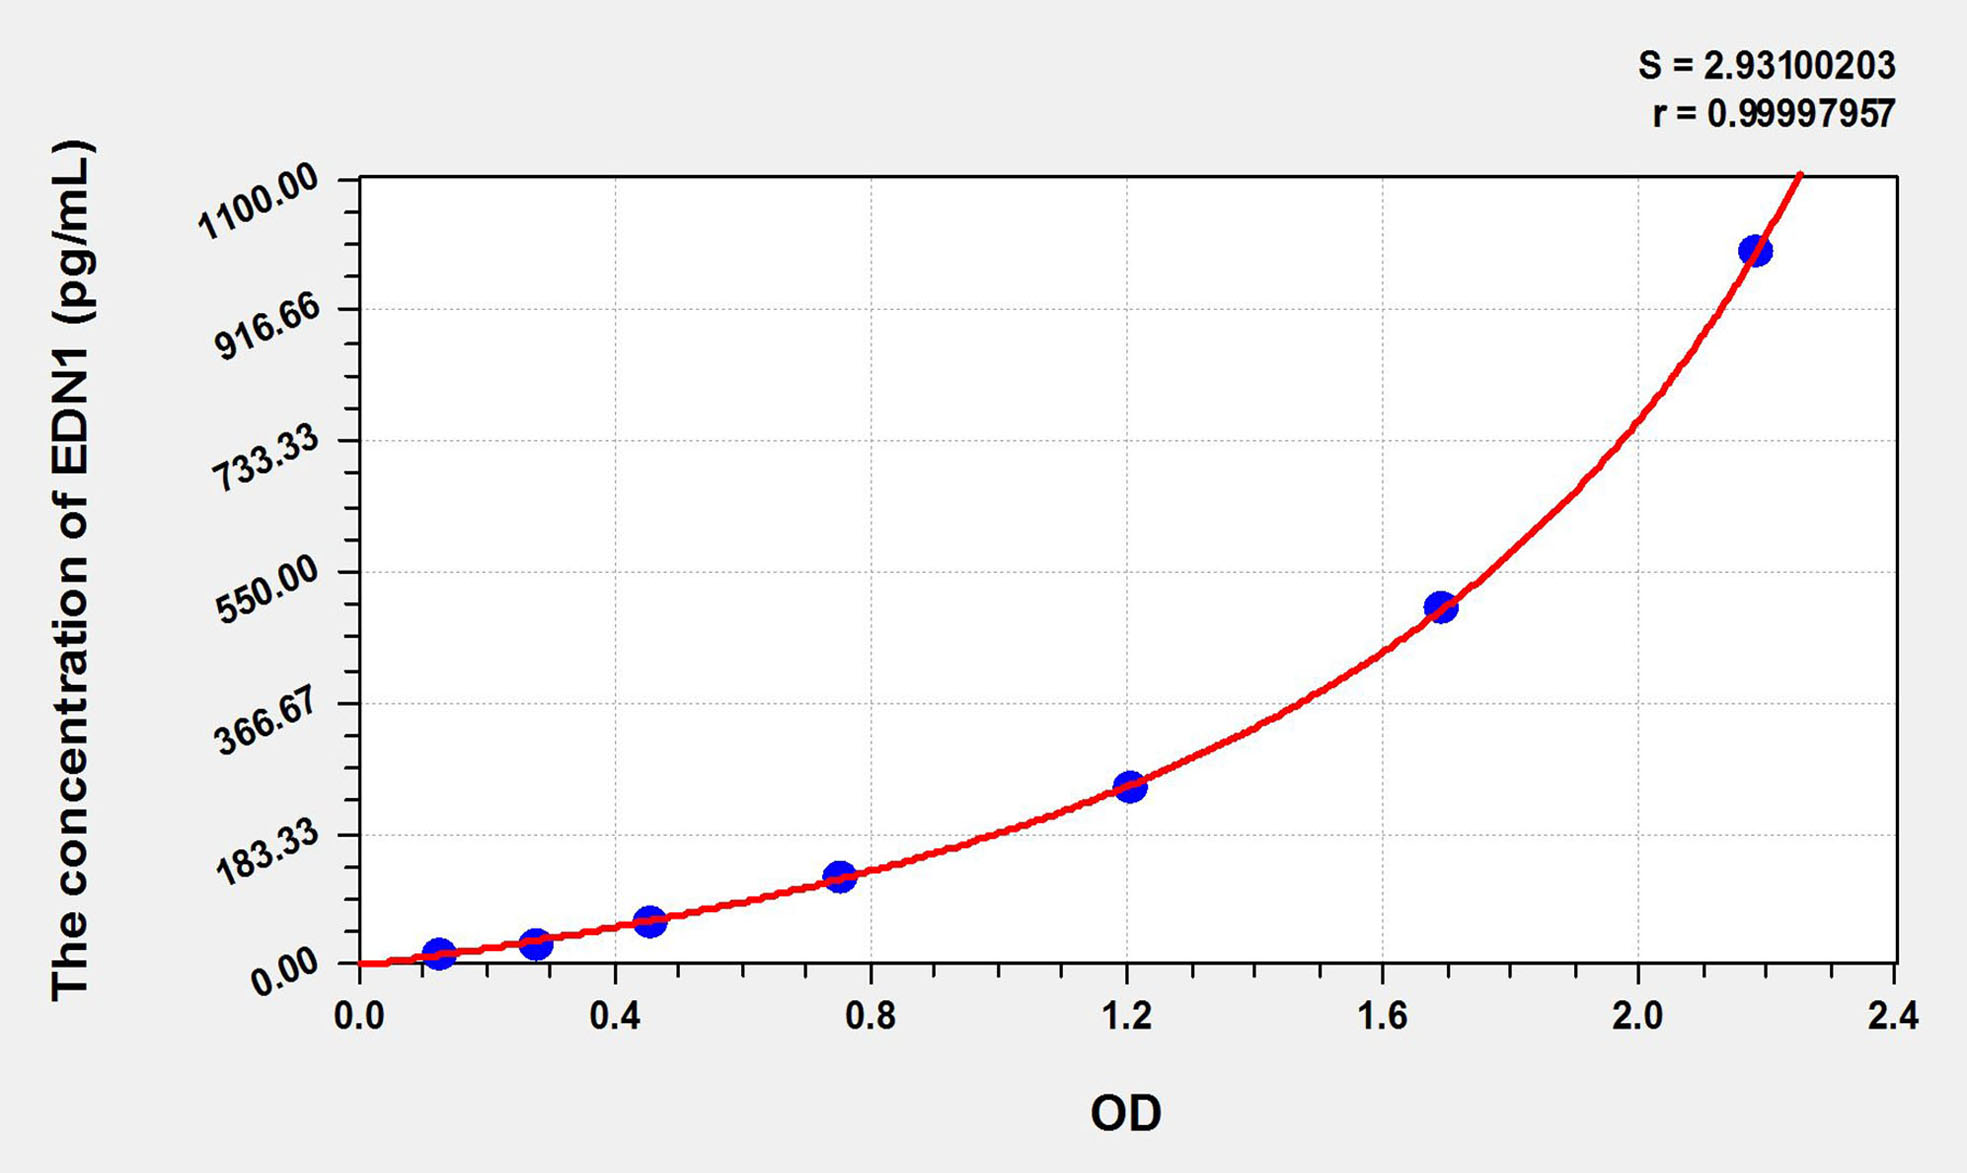
Standard curve
| Concentration (ng/mL) | OD | Corrected OD |
|---|---|---|
| 1000.00 | 2.256 | 2.170 |
| 500.00 | 1.770 | 1.684 |
| 250.00 | 1.283 | 1.197 |
| 125.00 | 0.835 | 0.749 |
| 62.50 | 0.541 | 0.455 |
| 31.25 | 0.363 | 0.277 |
| 15.63 | 0.212 | 0.126 |
| 0.00 | 0.086 | 0.000 |
Precision
Intra-assay Precision (Precision within an assay):CV%<8%
Three samples of known concentration were tested twenty times on one plate to assess intra-assay precision.
Inter-assay Precision (Precision between assays):CV%<10%
Three samples of known concentration were tested in forty separate assays to assess inter-assay precision.
Recovery
Matrices listed below were spiked with certain level of recombinant ET-1 and the recovery rates were calculated by comparing the measured value to the expected amount of ET-1 in samples.
| Matrix | Recovery range | Average |
|---|---|---|
| serum(n=5) | 81-96% | 88% |
| EDTA plasma(n=5) | 78-94% | 86% |
| Heparin plasma(n=5) | 90-103% | 96% |
Linearity
The linearity of the kit was assayed by testing samples spiked with appropriate concentration of ET-1 and their serial dilutions. The results were demonstrated by the percentage of calculated concentration to the expected.
| Matrix | 1:2 | 1:4 | 1:8 | 1:16 |
|---|---|---|---|---|
| serum(n=5) | 92-105% | 92-101% | 80-94% | 86-101% |
| EDTA plasma(n=5) | 88-102% | 86-92% | 91-103% | 89-97% |
| Heparin plasma(n=5) | 85-94% | 92-101% | 87-96% | 82-90% |
