
ELK Biotechnology
SKU:ELK9397
Rat PIGF(Phosphatidylinositol-glycan biosynthesis class F protein) ELISA Kit
Rat PIGF(Phosphatidylinositol-glycan biosynthesis class F protein) ELISA Kit
Regular price
$458.00 USD
Regular price
Sale price
$458.00 USD
Unit price
per
Shipping calculated at checkout.
Couldn't load pickup availability
Rat PIGF(Phosphatidylinositol-glycan biosynthesis class F protein) ELISA Kit
Overview
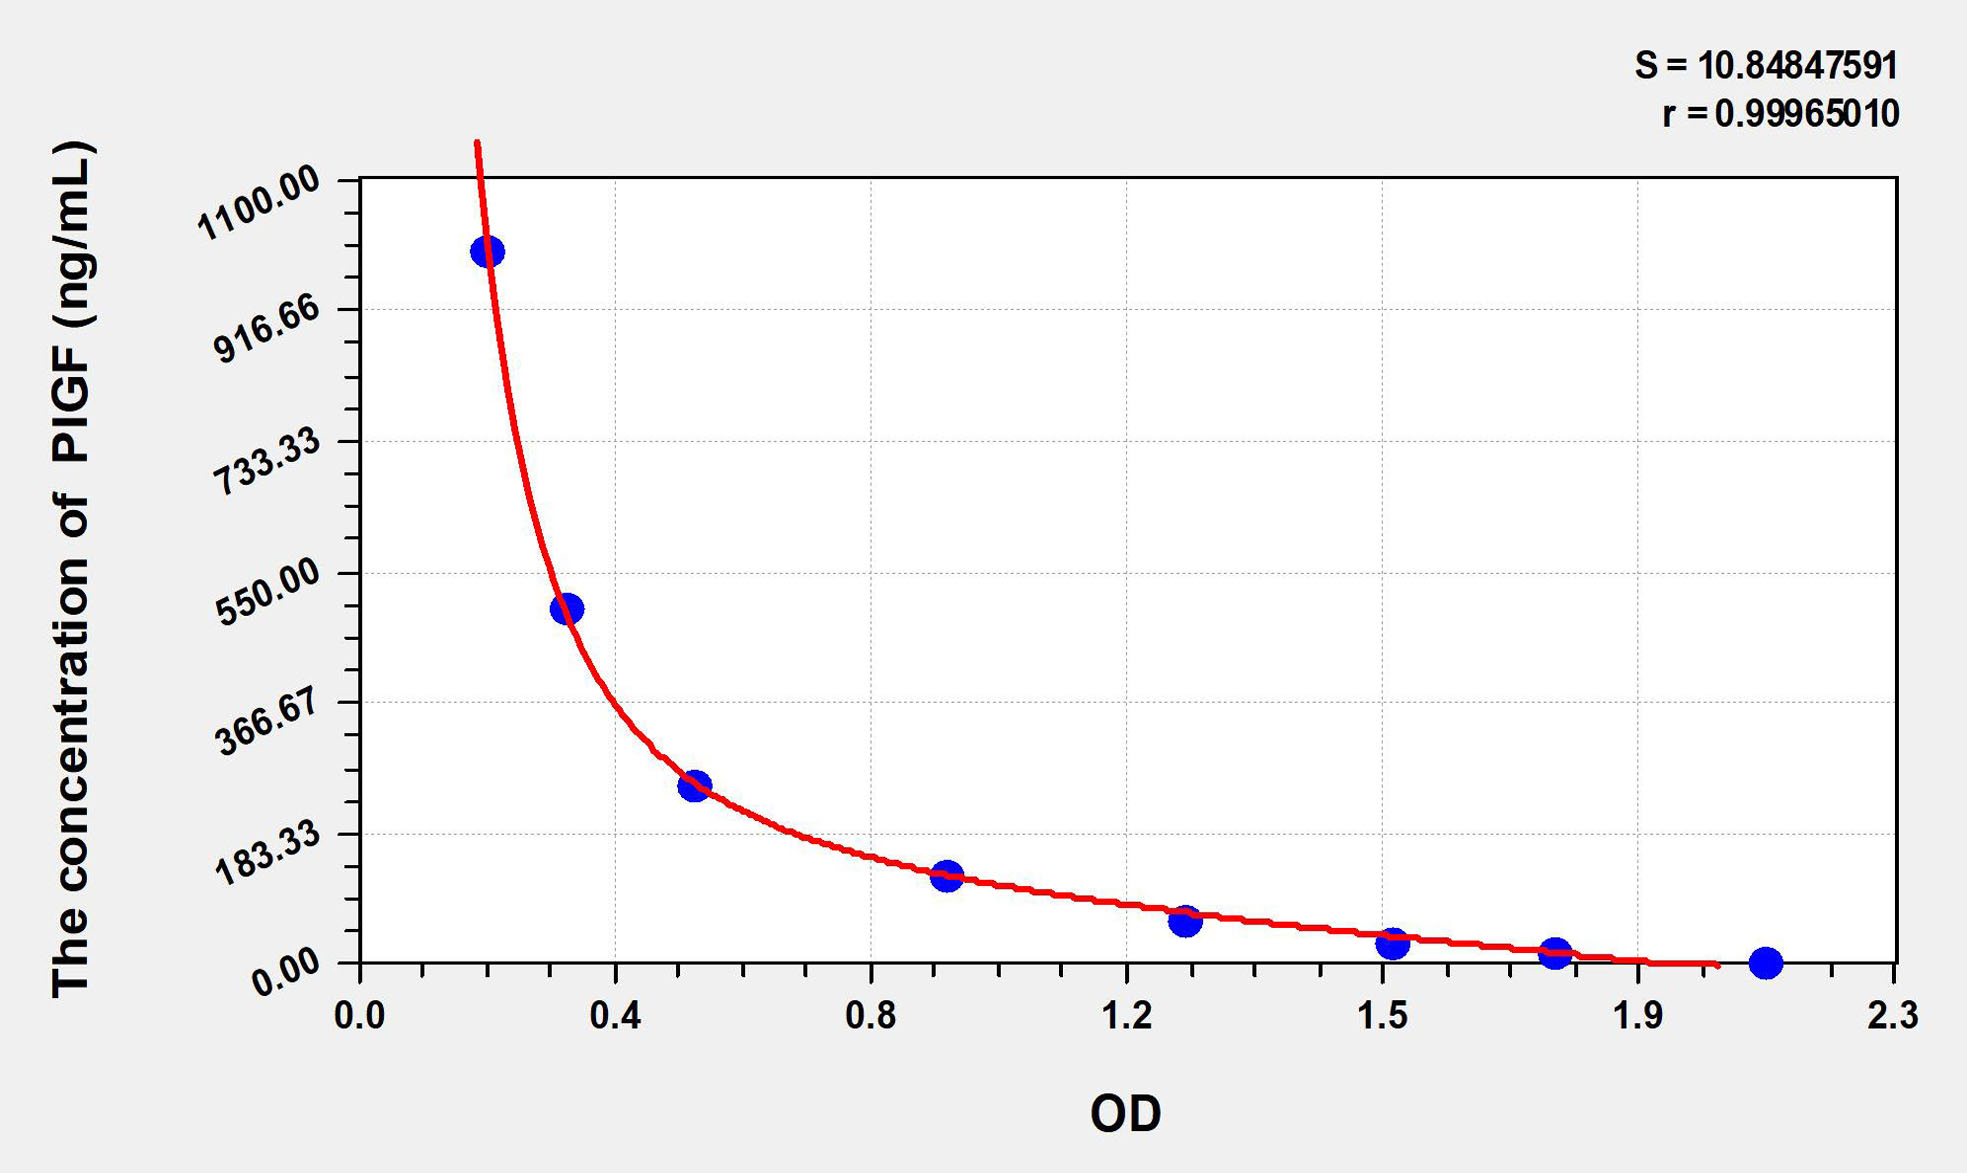
Standard curve
| Concentration (ng/mL) | OD | Corrected OD |
|---|---|---|
| 1000.00 | 0.217 | — |
| 500.00 | 0.336 | — |
| 250.00 | 0.527 | — |
| 125.00 | 0.899 | — |
| 62.50 | 1.253 | — |
| 31.25 | 1.557 | — |
| 15.63 | 1.796 | — |
| 0.00 | 2.112 | — |
Precision
Intra-assay Precision (Precision within an assay):CV%<8%
Three samples of known concentration were tested twenty times on one plate to assess intra-assay precision.
Inter-assay Precision (Precision between assays):CV%<10%
Three samples of known concentration were tested in forty separate assays to assess inter-assay precision.
Recovery
Matrices listed below were spiked with certain level of recombinant F and the recovery rates were calculated by comparing the measured value to the expected amount of F in samples.
| Matrix | Recovery range | Average |
|---|---|---|
| serum(n=5) | 95-107% | 101% |
| EDTA plasma(n=5) | 81-95% | 88% |
| Heparin plasma(n=5) | 87-95% | 91% |
Linearity
The linearity of the kit was assayed by testing samples spiked with appropriate concentration of F and their serial dilutions. The results were demonstrated by the percentage of calculated concentration to the expected.
| Matrix | 1:2 | 1:4 | 1:8 | 1:16 |
|---|---|---|---|---|
| serum(n=5) | 91-103% | 85-94% | 79-96% | 98-105% |
| EDTA plasma(n=5) | 82-93% | 95-102% | 93-101% | 87-96% |
| Heparin plasma(n=5) | 82-93% | 89-97% | 85-94% | 78-96% |
